Tinybird for Real-World Analytics: Tracking My Resume
I’ve played with Tinybird examples and mock datasets, but hadn’t used it for a real project until now. Recently, I built a simple landing page resume using HTML, CSS, and vanilla JavaScript. I skipped Google Analytics due to the expected low traffic.
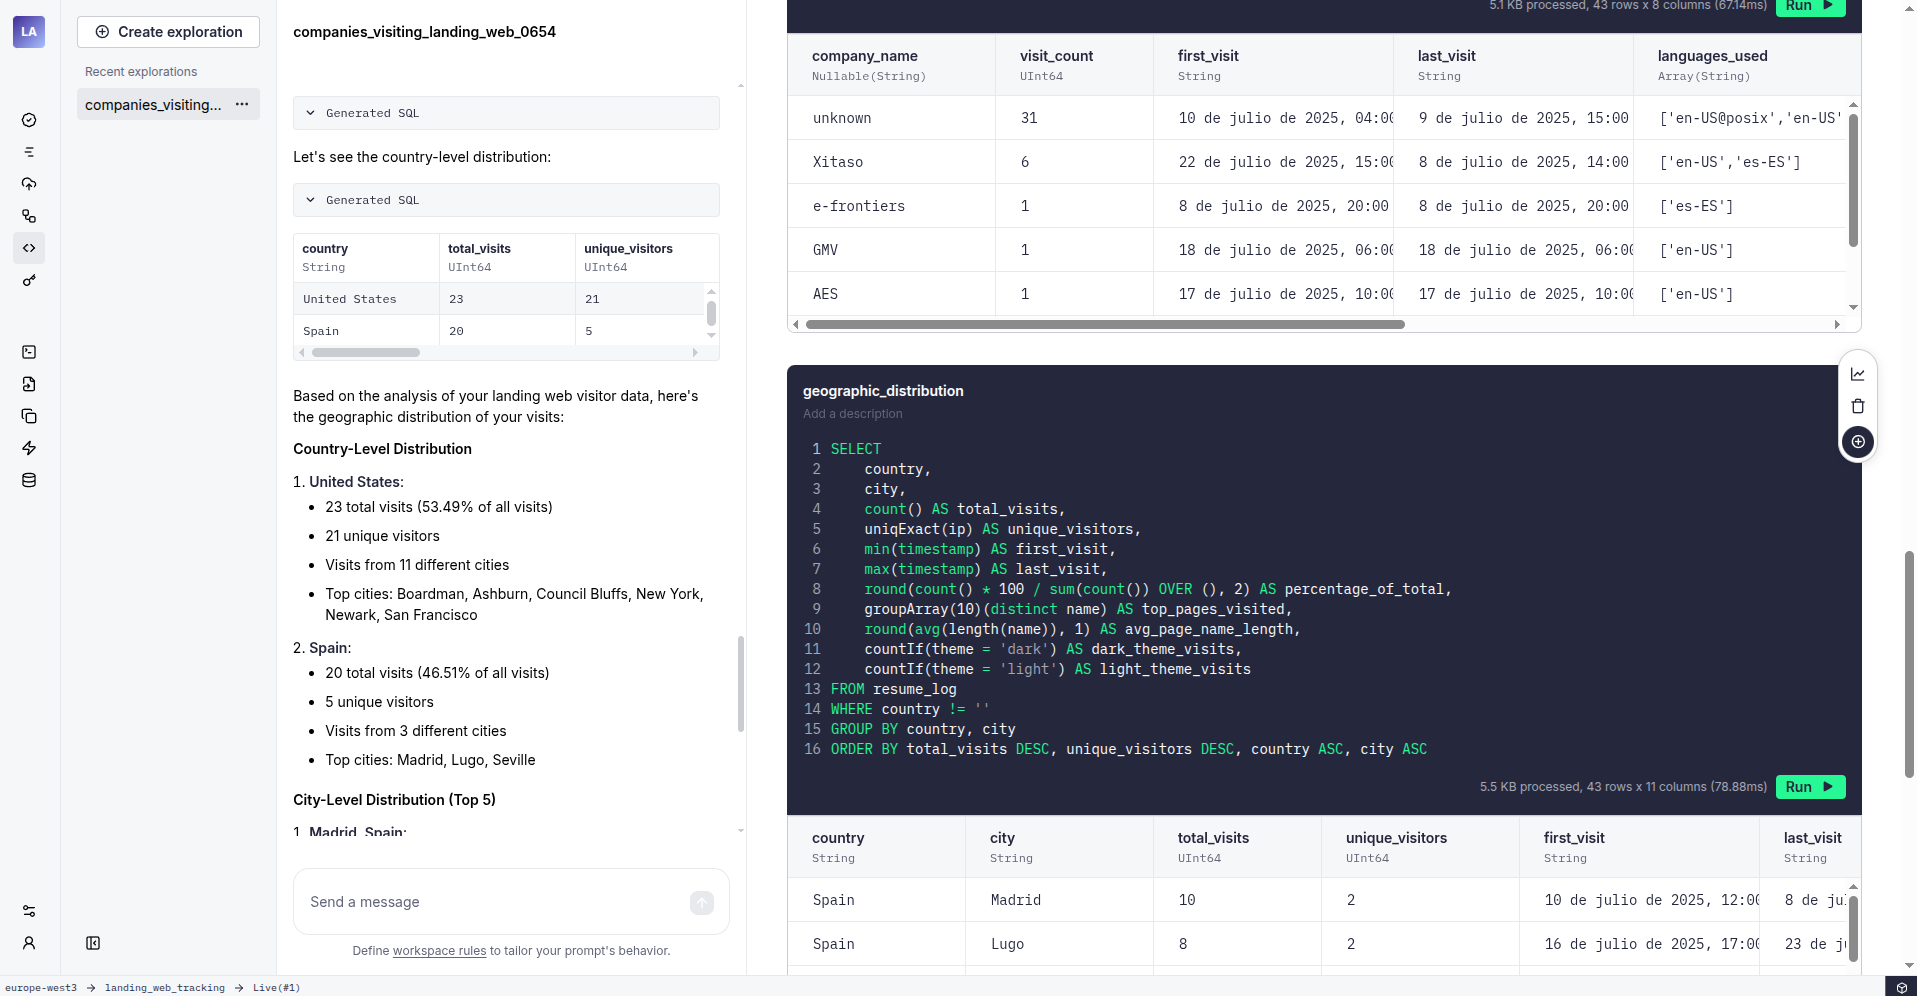
However, since the main goal was to track who viewed my resume, I created two Netlify functions: one logged access to Google Sheets, and the other sent me a Telegram notification. My first step was migrating these logs from Google Sheets to Tinybird.
This immediately revealed some advantages. While I rarely checked the Google Sheet, Tinybird allowed quick data exploration using plain English.
After updating my Netlify function to push data to Tinybird, I realized my elaborate date format was hindering my workflow:
new Date().toLocaleDateString("es-ES", {
  year: "numeric",
  month: "long",
  day: "numeric",
  hour: "2-digit",
  minute: "2-digit",
}); // Output: "24 de julio de 2025, 17:45"
I changed my Tinybird schema to use a standard DateTime format. Since my dataset was small, I truncated the existing data, created a simple FORWARD_QUERY, and then backfilled the new schema using a Python script to convert the old date format:
import csv
import json

MONTHS = {
        'enero': '01',
        'febrero': '02',
        'marzo': '03',
        'abril': '05',
        'junio': '06',
        'julio': '07',
        'agosto': '08',
        'septiembre': '09',
        'octubre': '10',
        'noviembre': '11',
        'diciembre': '12'
}

def text_to_timestamp(date):
    parts = date.split(',\xa0')
    date_part = parts[0]
    time_part = parts[1]

    date_components = date_part.split(' de ')
    day = date_components[0].zfill(2)
    month = MONTHS[date_components[1]]
    year = date_components[2].zfill(4)

    return f'{year}-{month}-{day} {time_part}:00'


def csv_to_njson(filename):
    with open(f'{filename}.csv', 'r') as fin:
        reader = csv.reader(fin)
        with open(f'{filename}.ndjson', 'w') as fout:
            for row in reader:
                record = {
                    'timestamp': text_to_timestamp(row[0]),
                    'name': row[1],
                    'language': row[2],
                    'useragent': row[3],
                    'theme': row[4],
                    'ip': row[5],
                    'city': row[6],
                    'code': row[7],
                    'country': row[8]
                }
                fout.write(json.dumps(record) + '\n')

if __name__ == '__main__':
    import sys
    from pathlib import Path
    filename = Path(sys.argv[1]).with_suffix('')
    print(sys.argv[1], filename)
    csv_to_njson(filename)
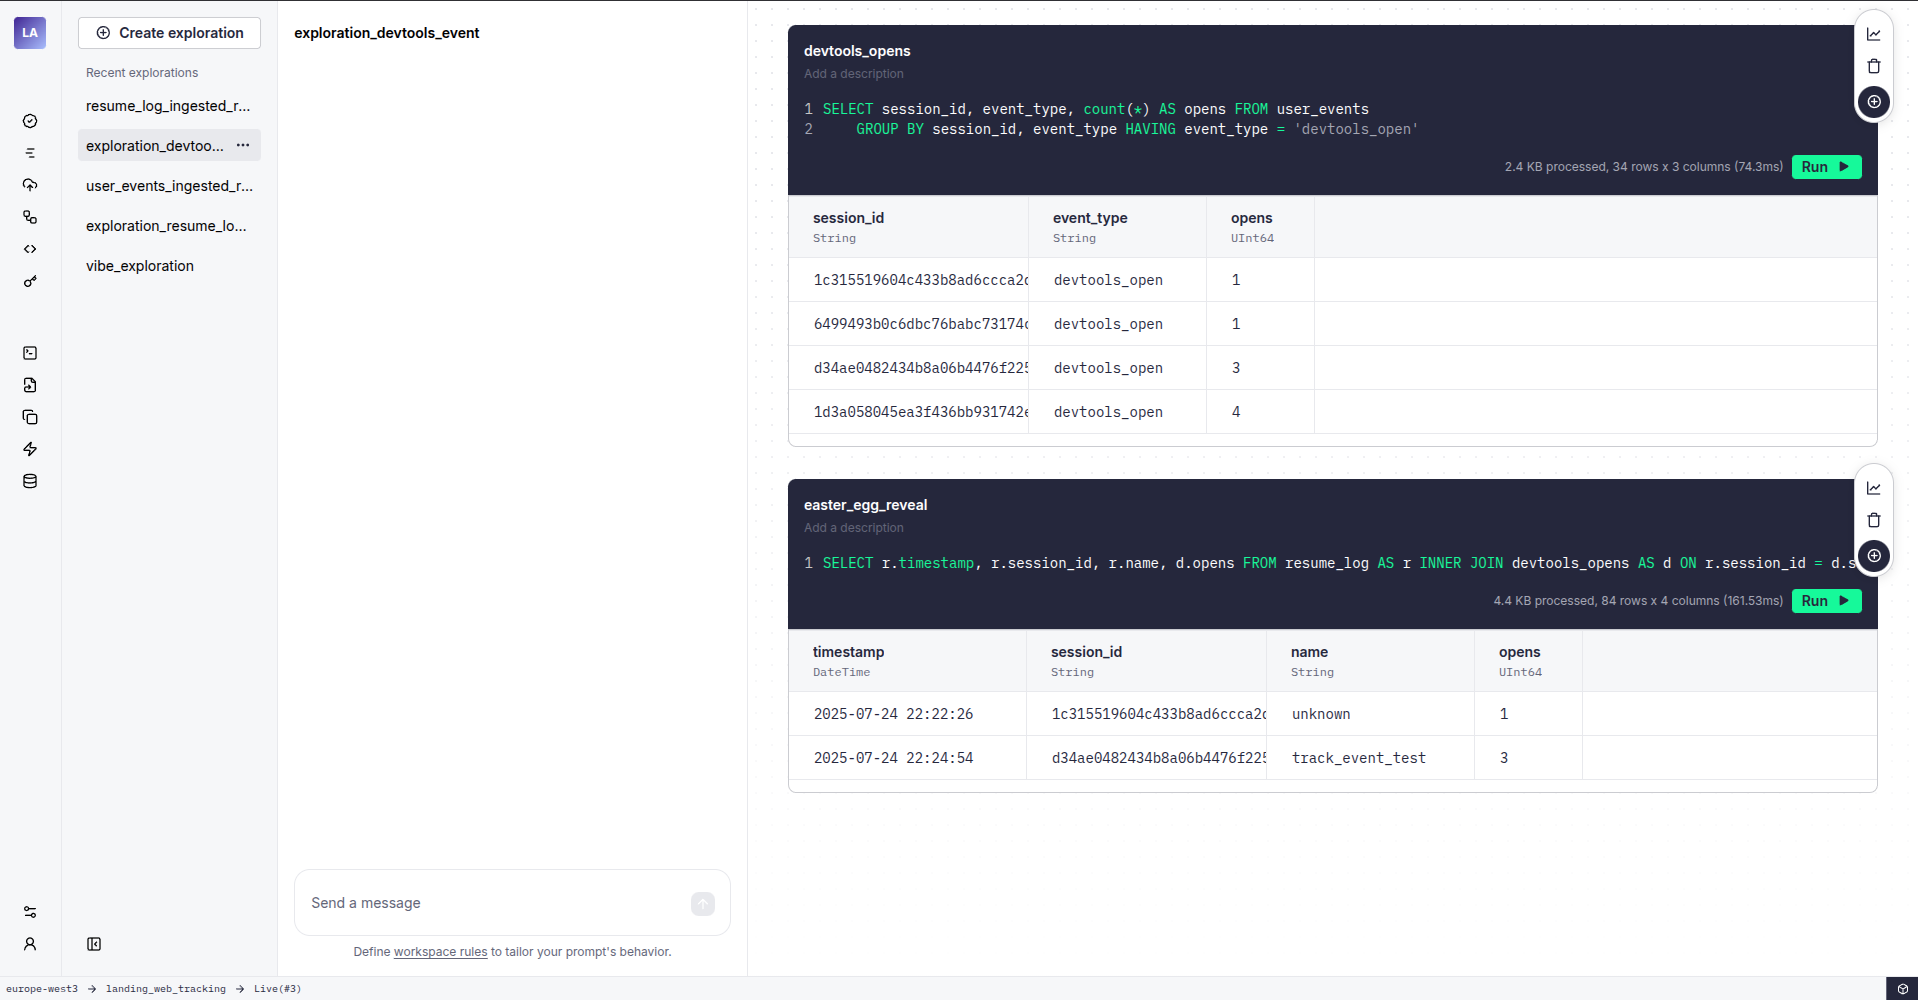
With the data migrated, I adjusted my landing page to send timestamps in the correct format (keeping the fancy format for Telegram). Tinybird’s flexibility made it easy to track interactions with custom web components and even a hidden “easter egg” in the developer console. Now I can see who’s really digging into my site!
./Quick Insights via TUI
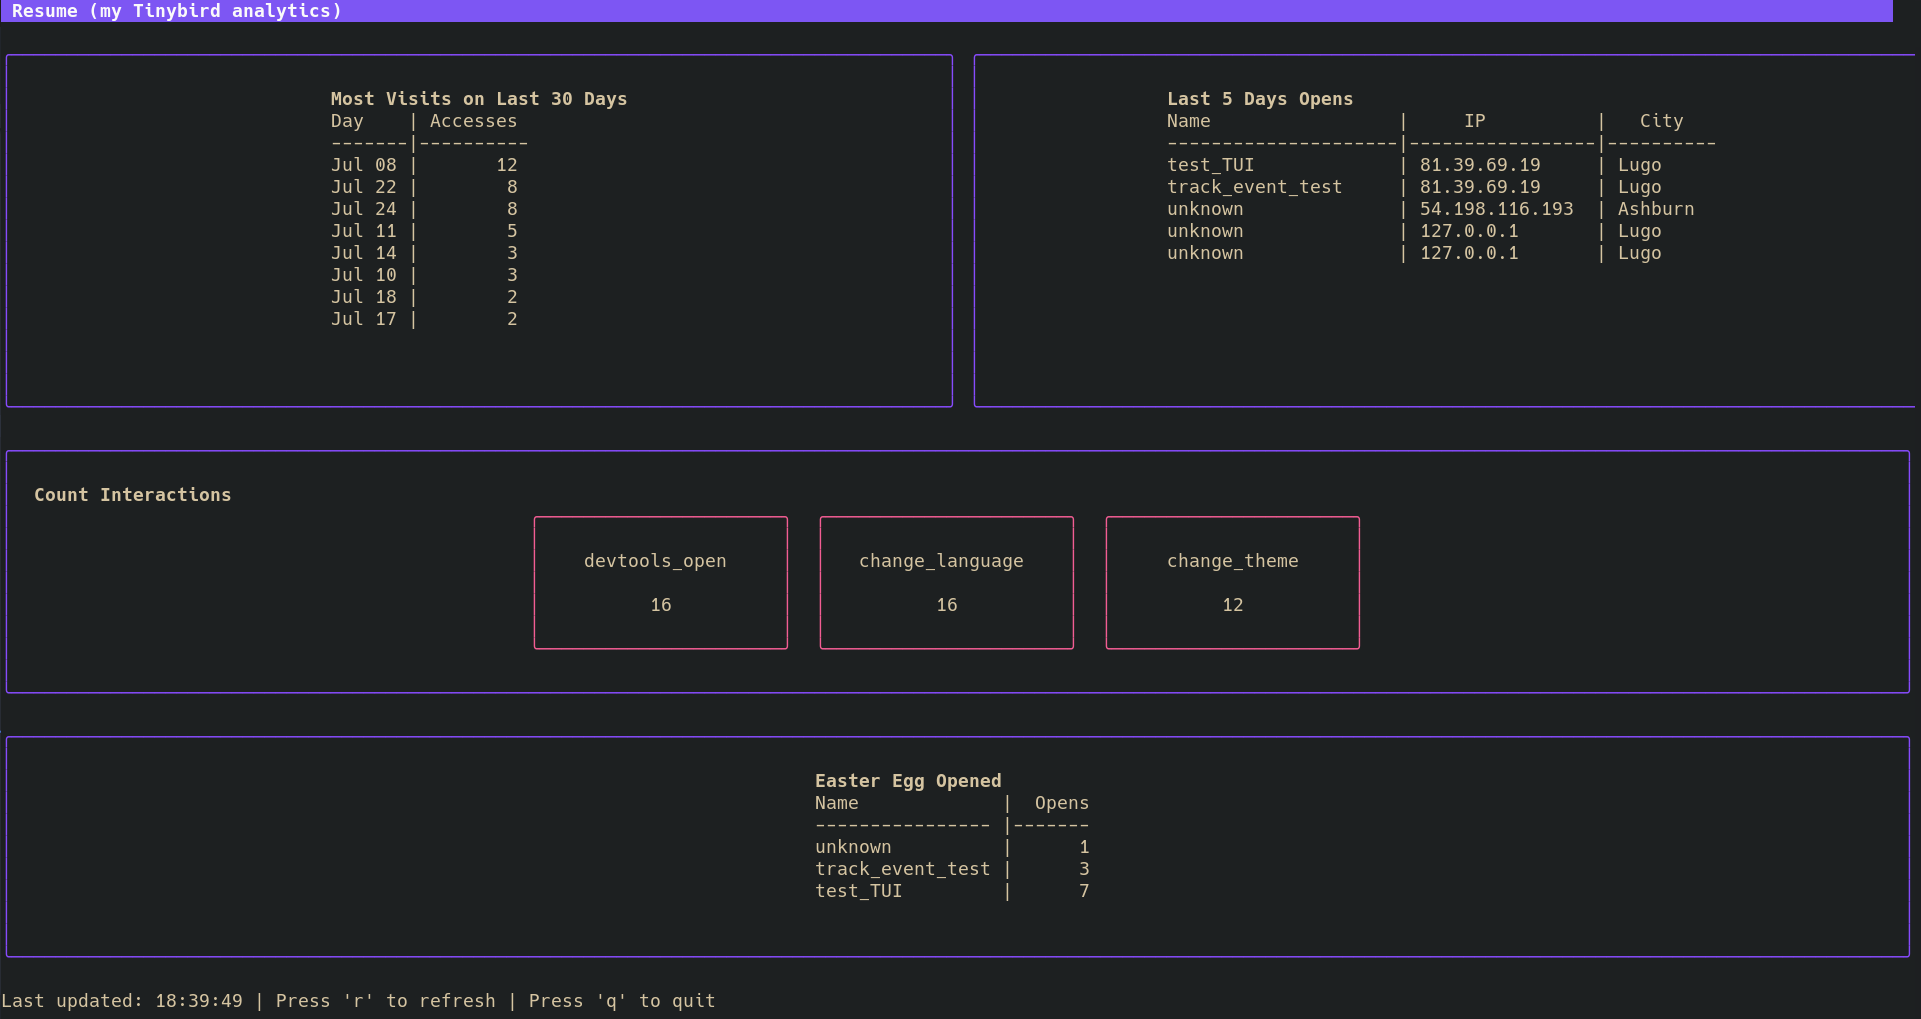
While testing, I set up a few Tinybird endpoints and, with some prompting, got Copilot to generate a TUI application for quick resume analytics directly from my terminal. It even wrote its own prompts!
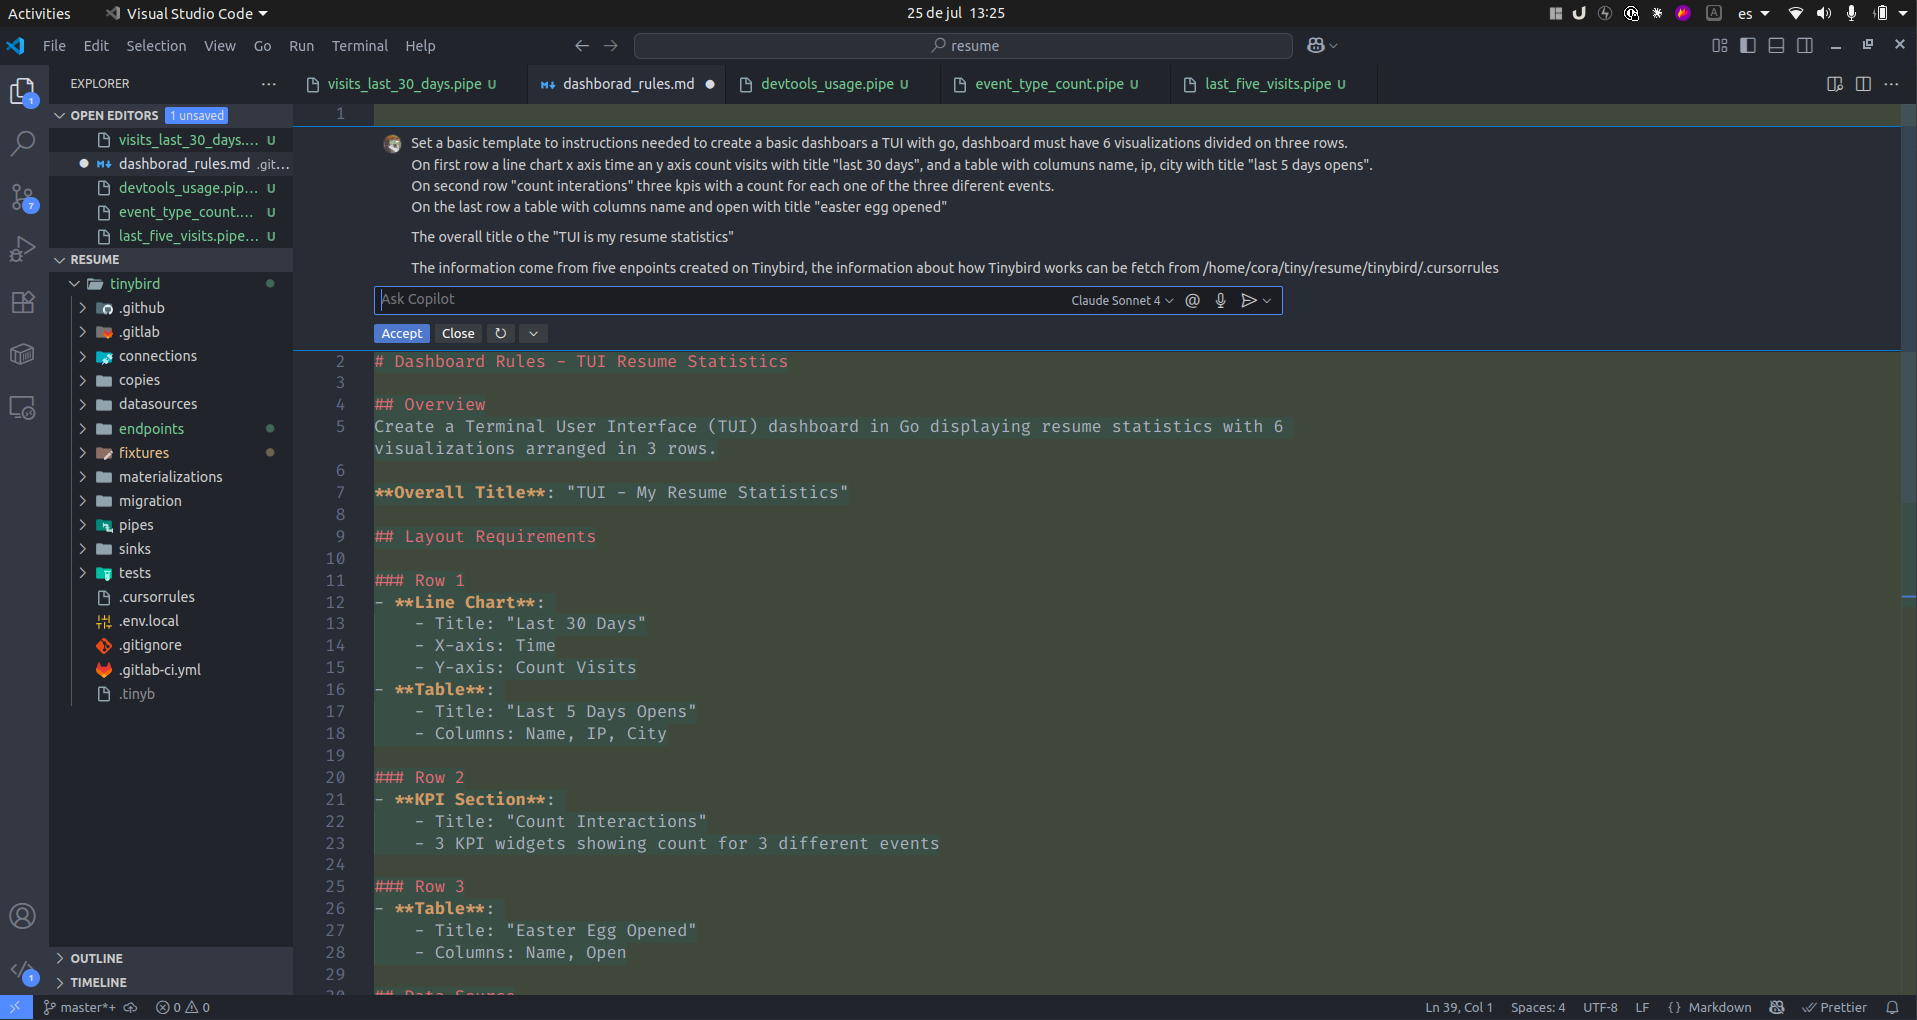
The result, after a few iterations, was pretty slick:
$ make install
go build -o resume-analytics .
sudo mv resume-analytics /home/cora/.local/bin
./Conclusion
- Pushing data to Tinybird was significantly easier than wrestling with Google Sheets and Netlify credentials.
- Tinybird’s flexibility made customizing my analytics a breeze.
- I ended up with a neat TUI for at-a-glance resume analytics, all without leaving my terminal. Pretty cool!